How to Build High-Converting QR Posts for Offline Marketing
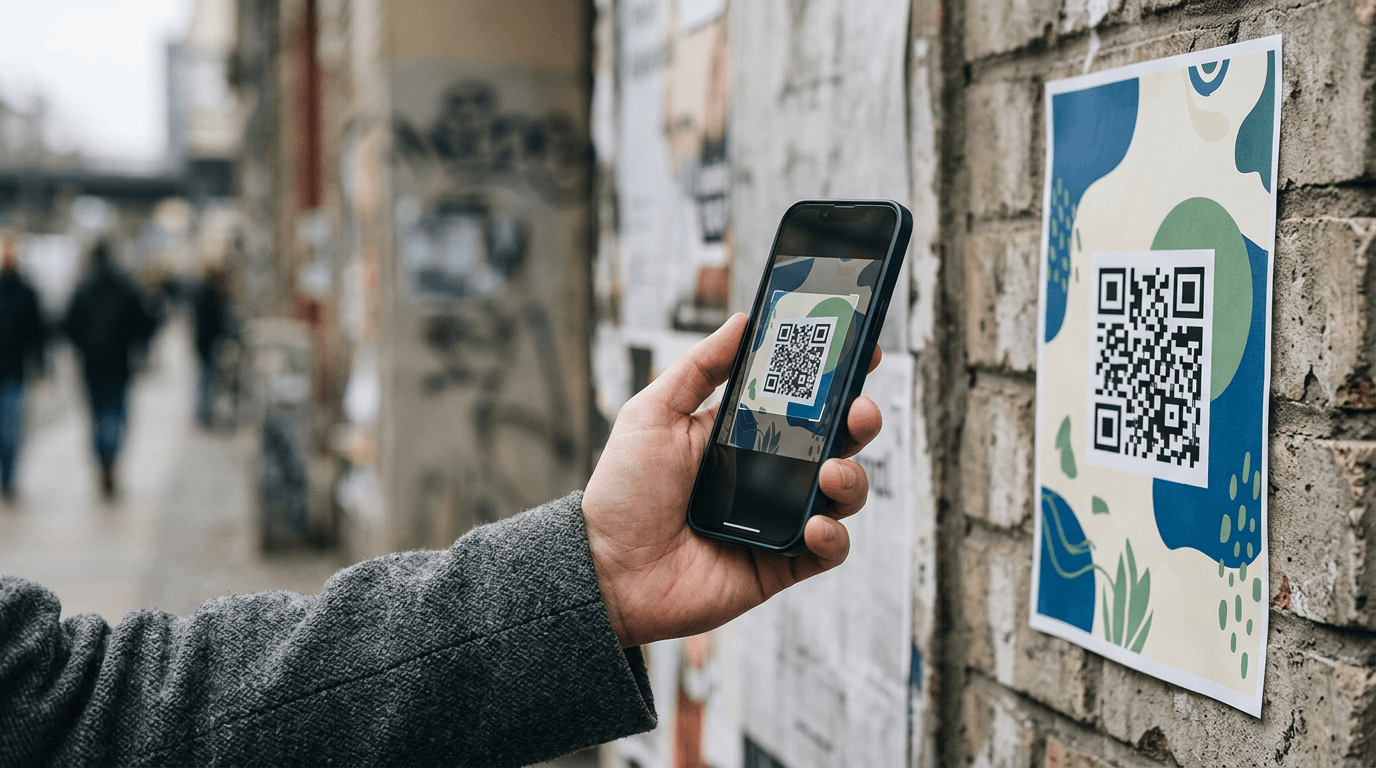
A marketer prints a large batch of flyers expecting a surge in online sales, only to find a massive bounce rate because the destination takes too long to load on a cellular connection. QR codes do not generate interest; they capture intent that already exists in the physical world. If you want qr posts to bridge the gap between offline foot traffic and online conversion, you have to engineer the entire scan-to-cart pathway before you ever open a design file. A scan is just a mechanical action. What happens after the smartphone camera closes determines whether the physical campaign actually drives revenue or merely wastes printer ink.
Quick Summary
Bridging offline marketing with digital conversion requires routing physical scans to mobile-optimized, centralized landing pages rather than generic desktop homepages. This process demands precise code generation, contextual physical placement, and structured performance tracking.
- Always route offline scans to a dedicated mobile landing page or link-in-bio platform.
- Embed UTM parameters into the destination URL before generating the matrix.
- Utilize dynamic tracking codes to allow backend link updates without reprinting assets.
- Scale the printed code size to match the anticipated scanning distance (10:1 ratio).
- Track destination bounce rates alongside raw scan volume to verify relevance.
Table of Contents
- 1. Define the digital destination for your qr posts
- 2. Configure tracking and generate the matrix
- 3. Position the collateral in high-dwell environments
- 4. Execute the qr posting deployment schedule
- 5. Correlate scan data with offline sales events
- Common Pitfalls & Troubleshooting
- FAQ
1. Define the digital destination for your qr posts
When a user scans a code on a physical poster, they transition from an offline environment to a digital interface in less than two seconds. The destination must respect the constraints of that transition. Users walking down a street or waiting in a store are relying on cellular data networks and viewing screens with heavy glare. The destination must be a lightweight, mobile-first environment that directly answers the context of the physical location.

Routing scans to a centralized platform like HeyLink.me - One Link for Everything allows you to consolidate multiple conversion paths into a single interface. If the code is on a flyer promoting a new product line, the destination should feature that exact product line at the top of the screen, followed immediately by relevant social channels or mailing list sign-ups. You are capturing split-second attention; the user will not navigate through a complex dropdown menu on their phone to find what the poster promised.
The mistake practitioners make at this stage is pointing the QR code directly to a standard corporate homepage. A homepage is designed for discovery, while a scan indicates specific intent. Dropping a user who scanned a specific product code onto a generic homepage forces them to search for the offer manually. This friction leads directly to immediate abandonment. The destination must carry the scent of the physical material that prompted the scan.
2. Configure tracking and generate the matrix
A QR code is simply a visual representation of a text string, which in marketing is almost always a URL. To measure offline engagement, that URL must carry tracking data. Before generating the physical matrix, you must append UTM parameters - specifically source, medium, and campaign tags - to the destination URL. This ensures your analytics software registers the traffic as originating from a specific offline asset rather than generic direct traffic.
You must generate a dynamic QR code rather than a static one. A dynamic code embeds a short redirect URL into the matrix, which then forwards the user to your final, UTM-tagged destination. This mechanical difference is vital because it allows you to change the final destination at any time without altering the printed matrix. If a promotion ends, you simply update the redirect in your backend provider.
When configuring the matrix, you must select the appropriate error correction level. Standard codes use Level L to recover a minimal amount of data, but for physical marketing materials that will be exposed to the elements, scratched, or folded, you should generate the code at Level H. Level H provides the highest available error correction, meaning a substantial portion of the physical code can be obscured or damaged and the smartphone camera will still resolve the link.
The fatal mistake in this step is generating static codes for large print runs. If a static code points to a promotional page and the marketing team later changes the URL structure of the website, the printed material becomes permanently broken. There is no way to fix a static code other than physically replacing every poster, flyer, and business card.
3. Position the collateral in high-dwell environments
A user needs approximately four to six seconds to notice a physical call-to-action, retrieve their device, open the camera application, and focus on the matrix. Therefore, physical placement entirely dictates scan volume. Transit stops, checkout counters, restaurant tables, and waiting rooms are high-dwell environments where this behavioral chain can occur naturally.
The physical size of the printed code must scale mathematically with the scanning distance. The industry standard rule is a 10:1 ratio. For every ten inches of distance between the smartphone and the print material, the QR code must be at least one inch wide. A code meant to be scanned by pedestrians passing a storefront window from three feet away must be at least 3.6 inches in diameter.
Practical rule: Never place a QR code where the user has less than ten seconds to safely interact with it, such as on highway billboards, moving fleet vehicles, or digital screens that rotate every five seconds.
The most frequent mistake in placement is treating the code as a design afterthought. Graphic designers often shrink the matrix to fit neatly into the corner of a crowded flyer, reducing it to half an inch in width. At this size, standard smartphone cameras struggle to focus on the dense data pattern, effectively killing the entry point of the campaign before the user even attempts to scan.
4. Execute the qr posting deployment schedule
Coordinating the physical rollout - the actual qr posting - requires aligning print delivery with your digital backend architecture. Physical deployment must be staggered to manage risk. You should never release the entire print run on day one. Start with a localized proofing batch in one physical location to monitor scan reliability, redirect functionality, and destination load times under real-world cellular conditions.
Once the pilot proves successful, execute the scaled rollout. This physical distribution should be timed to coordinate with digital awareness campaigns. If you are placing coded posters in a specific commercial district, configure geo-targeted social advertisements within that exact radius during the same week. This creates a multiplier effect, reinforcing the offline physical presence with digital repetition.
The deployment phase also requires strict material auditing. Print finishes drastically alter the scannability of a code. Always request matte finishes for outdoor or heavily lit environments. High-gloss laminates reflect overhead lighting or sunlight directly into the smartphone camera lens, washing out the contrast required for the device to read the data squares.
The mistake made during deployment is approving massive print runs based on a digital proof rather than a physical test. A code that scans perfectly on a backlit computer monitor will behave completely differently when printed on textured cardboard in a dimly lit retail environment. Always require a physical proof printed on the final substrate before authorizing the full rollout.
5. Correlate scan data with offline sales events
A scan is not a conversion; it is merely a pageview initiated from an offline source. To evaluate the strategy accurately, you must measure what happens after the mobile page renders. Using the analytics dashboard provided by your redirect service or link platform, filter the data to analyze the time of day, day of the week, and geographic cluster of the scans.
To prove return on investment, correlate this mobile traffic spike with offline business events. Compare the influx of traffic carrying your specific offline UTM tags against actual sales data, email capture rates, or incoming lead inquiries during the deployment window. If you distributed flyers at a weekend trade show, you should see a corresponding spike in targeted mobile traffic during those specific hours, followed by a measurable conversion event on the destination page.
The critical mistake in analytics is reporting raw scan volume as the primary success metric. If a retail poster generates a massive influx of scans but the analytics show a near-total bounce rate with an incredibly short average session duration, the campaign failed. High scan volumes combined with low conversion rates indicate a fundamental disconnect: either the physical call-to-action misled the user about what they would get, or the digital destination was too cumbersome to navigate on a mobile device.
Common Pitfalls & Troubleshooting
Offline-to-online campaigns fail in predictable ways that often look identical from a distance: a low conversion rate. Diagnosing the exact failure requires isolating the step where the user dropped off.
The Laminated Glare
- Symptom: The analytics show zero or single-digit scans despite heavy foot traffic near the physical materials.
- Fix: The issue is physical, not digital. Visit the location and attempt to scan the material yourself. If glare from lighting or sunlight is washing out the code, you must reprint using a matte finish or physically relocate the asset away from direct light sources.
The Dead Redirect
- Symptom: Users attempt to scan the code, but their browser returns a 404 error or a warning that the site cannot be reached.
- Fix: Check your dynamic link provider. This usually happens when the subscription to the routing service lapses, or when the final destination URL was altered without updating the intermediary redirect link. Log into your provider and update the destination URL to restore functionality without changing the print material.
The Desktop Redirect
- Symptom: Analytics report a high volume of scans and pageviews, but zero conversions and an immediate 100% bounce rate.
- Fix: The Desktop Redirect is the most frequent real cause of campaign failure. The code is working perfectly, but the destination is hostile to mobile users. Load the destination page on a throttled 3G cellular connection. If rendering takes longer than three seconds, strip out heavy image assets, remove pop-up banners, and transition the traffic to a minimalist, mobile-first landing page.
FAQ
Can I change where the QR code points after it is printed?
Yes, but only if you generated a dynamic code. Dynamic codes contain a short tracking URL that forwards traffic to your final destination. You can change the final destination in your software dashboard at any time. If you printed a static code, the destination is permanently hardcoded into the matrix and cannot be altered.
Why do my printed codes look blurry and fail to scan?
Blurry codes result from using raster image formats (like low-resolution PNGs or JPEGs) and stretching them during the design process. Always download and design with vector formats like SVG or EPS. Vector files use mathematical equations to render the image, ensuring the edges of the matrix remain perfectly sharp regardless of how large you scale the print.
Do users still need to download a specific app to scan these?
No. Both iOS and Android integrated native scanning capabilities directly into their default camera applications years ago. The user simply points their standard camera at the matrix, and a clickable link bubble appears on the screen. Removing the barrier of downloading a third-party app is what made modern offline-to-online marketing viable.
How do I track which physical location generated the most traffic?
Do not use the same code for every location. If you want to track separate venues, generate a distinct dynamic code for each location, even if they all point to the same final landing page. Append a unique UTM parameter to each code (e.g., utm_source=downtown_store vs utm_source=uptown_store). This allows your analytics software to segment the traffic based on exactly which poster the user stood in front of.